Benchmarking Sodium Lauryl Ether Sulphate (SLES) prices by export origin in 2026 is becoming a critical procurement tool for detergent and personal care manufacturers. Even for identical specifications, price differences of 15 to 30 percent persist between origins due to feedstock access, processing economics, compliance costs, and logistics exposure.
With global SLES prices expected to trend moderately higher in 2026, buyers who understand these structural price gaps gain stronger negotiation leverage and better control over landed costs.
Global SLES Market Context in 2026
Demand growth and production concentration
Global SLES demand continues to expand at an estimated 5 to 7 percent annually, driven primarily by household detergents and personal care products in Asia Pacific. Market value is projected to sit around USD 1.6 billion in 2026, with Asia accounting for the majority of both production and consumption.
Production remains highly concentrated in Southeast Asia, followed by India, China, and emerging capacity in the Middle East. Europe plays a smaller role in export volumes and focuses mainly on high compliance or specialty grades.
Why export-origin pricing differs
Despite product standardization, SLES pricing varies widely by origin. These differences are not short-term anomalies but reflect structural cost advantages and constraints that persist across market cycles.
Key Cost Drivers Behind SLES Pricing Differences
Feedstock access and fatty alcohol economics
Lauric-based fatty alcohols derived from palm kernel oil or coconut oil represent the single largest cost component in SLES production. Regions with direct access to palm kernel oil benefit from lower and more stable feedstock costs, while import-dependent producers face premiums and higher volatility.
Tight lauric oil availability in 2026 is expected to lift fatty alcohol costs globally, but origin-based gaps are likely to remain intact.
Ethoxylation and sulfation processing costs
Ethoxylation depends heavily on ethylene oxide pricing, energy costs, and plant scale. Integrated oleochemical producers with modern facilities generally achieve lower conversion costs per metric ton. Sulfation efficiency also varies by technology and environmental controls, influencing yield and waste handling costs.
Labor, utilities, and regulatory overhead
Labor and utilities account for a smaller but meaningful share of total cost. Southeast Asia and parts of the Middle East benefit from lower labor and energy expenses, while Europe carries structurally higher costs due to wages, utilities, and compliance requirements such as REACH.
Major SLES Export Origins and Pricing Characteristics
Southeast Asia: Indonesia and Malaysia
Southeast Asia remains the global pricing benchmark for SLES. Proximity to palm kernel oil, large-scale oleochemical integration, and established export infrastructure support competitive FOB pricing.
For 2026, Southeast Asian SLES is expected to remain the lowest baseline option for standard industrial and detergent grades. Buyers should still verify consistency, as quality can vary between producers.
South Asia: India
Indian SLES typically prices 10 to 15 percent above Southeast Asian supply. Import dependence for some feedstocks, strong domestic demand, and seasonal logistics disruptions contribute to this gap. India remains competitive for regional trade and mid-spec applications.
China
China offers strong scale and flexible production, but export pricing often reflects ethylene oxide volatility, freight exposure, and trade policies. China can be competitive for large-volume buyers who have qualified suppliers and stable logistics routes.
Middle East
Middle Eastern producers benefit from low utility costs and favorable routes into Europe and Africa. Pricing often sits between Southeast Asia and Europe, making the region attractive as a diversification option rather than a primary low-cost source.
Europe
European SLES prices carry a consistent premium due to higher operating and compliance costs. Exports focus on high-purity or tightly regulated grades. Europe is typically chosen for risk reduction or regulatory alignment rather than cost leadership.
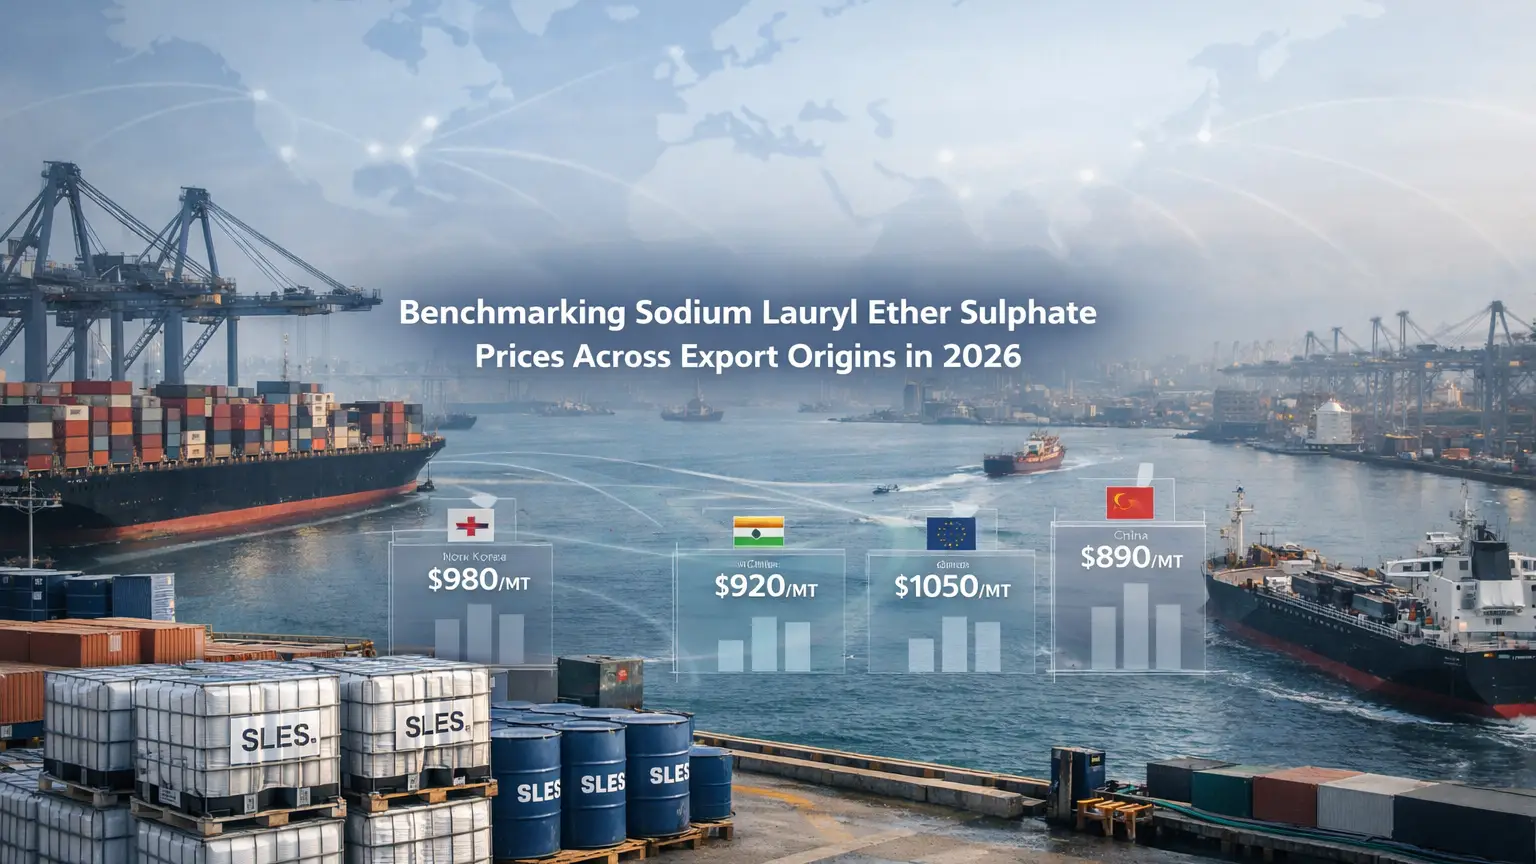
Indicative 2026 FOB Price Positioning by Origin
Relative competitiveness overview
While absolute prices depend on specification and volume, relative positioning is consistent across market sources:
- Southeast Asia: baseline reference
- India: moderately higher
- China: mid-range with volatility
- Middle East: mid-range with logistics advantages
- Europe: highest pricing tier
Buyers should normalize comparisons by active matter, viscosity, packaging, and Incoterms before drawing conclusions.
Logistics and Currency Impact on Landed SLES Costs
Freight and route sensitivity
FOB price advantages can disappear once freight is added. Long-haul routes from Asia to Europe or the Americas can add USD 100 to 200 per metric ton, while Middle East routes often reduce landed cost variability for nearby markets.
Exchange rate considerations
Currency movements influence effective pricing, particularly for buyers operating outside the US dollar zone. FX volatility in 2026 reinforces the value of short review cycles and partial hedging strategies for longer contracts.
Quality, Specification, and Certification Premiums
Grade-related price adjustments
Cosmetic and personal care grades typically command premiums over industrial grades due to tighter specifications and documentation requirements. Certification claims, where required, can also add cost depending on supply chain structure.
Managing quality risk
Lower prices only translate into savings if quality is consistent. Buyers should factor in rejection rates, reformulation risk, and audit outcomes when comparing suppliers across origins.
How Buyers Should Apply Export-Origin Benchmarking
Build structured price comparisons
Effective benchmarking compares at least three origins using standardized specs and landed cost assumptions. This approach reveals real cost drivers rather than headline price differences.
Use indexed or hybrid contracts
Linking part of the SLES price to fatty alcohol indices, freight bands, or currency ranges helps stabilize procurement costs and reduces renegotiation friction during volatile periods.
Balance cost and reliability
Many buyers adopt a split sourcing model, securing base volume from cost-competitive origins while maintaining secondary suppliers for continuity and risk management.
2026 Outlook for Export-Origin Competitiveness
Southeast Asia is expected to retain its structural cost advantage through 2026 due to feedstock proximity and scale. Middle East and China may gain share depending on freight dynamics and trade policy shifts. Across all origins, upward cost pressure from lauric feedstocks is likely, reinforcing the need for disciplined benchmarking.
Conclusion
Export-origin benchmarking remains one of the most effective tools for managing SLES procurement in 2026. Structural cost differences between regions will continue, even as short-term volatility comes and goes. Buyers who systematically compare origins, normalize landed costs, and align sourcing with quality and risk requirements can protect margins and improve supply security.
If you are evaluating SLES suppliers for detergents or personal care applications, Chemtradeasia can support your sourcing process by benchmarking prices across multiple export origins, aligning specifications, and coordinating competitive quotations that fit your logistics and compliance needs.
Leave a Comment